Wednesday, December 19, 2012

WEP 3

We followed the principles of a well designed experiment well. We used repetition when we did multiple trials to see the change in mass of the toilet paper. I learned that it is important to do multiple trials because you can have an outlier which will affect your data if it is not corrected with other trials. We used blocking when we looked at how ply count would affect absorbency. We used the controls effectively because we used the same brand of milk for all trials and left all conditions the same except for the ones we were trying to manipulate.

The most important thing that I learned through this was understanding that it takes a while to design a good experiment and you must consider many factors.
Thursday, December 13, 2012

Winter Project 2


Results are shown below. We measure effectiveness by largest change in mass of the toilet paper by looking at change in mass. A higher change in mass indicates more absorbency. The results are listed below. We found that for all toilet paper, the one ply was less effective than the two ply. We also found that milk was harder to absorb than water. The most absorbant brand quilted northern because it had the greatest two ply change in mass for one tsp of water at 6 grams. Also, on average, it's one ply change in mass was greater than all other brands therefore it is the best one ply brand. For milk, Angel Soft was the most absorbent at 3 and 3.5grams change in mass


Northern Quilted Soft

One Ply-0.5g
Two Ply-1.0g
1/2 tsp water average
2.67g
3g
trial one
trial two
trial three
3g
3g
2g
4g
2g
3g
tsp water average
4.67g
6g
trial one
trial two
trial three
4g
4g
5g
6g
7g
5g
1/2 tsp milk average
2g
2.67g
trial one
trial two
trial three
2g
2g
2g
3g
2g
2g
tsp milk average
3.67g
4.33g
trial one
trial two
trial three
3g
4g
3g
5g
3g
5g

Angel Soft

One Ply-0.5g
Two Ply-1.0g
1/2 tsp water average
2g
2.5g
trial one
trial two
trial three
2g
2g
2g
4g
2g
3g
tsp water average
3g
4.5g
trial one
trial two
trial three
3g
4g
2g
6g
7g
5g
1/2 tsp milk average
3g
3g
trial one
trial two
trial three
3g
3g
3g
3g
2g
2g
tsp milk average
3.5g
3.5g
trial one
trial two
trial three
3.5g
3.5g
3.5g
5g
3g
5g

 Charmin Toilet Paper Brand


One Ply-0.5g
Two Ply-1.0g
1/2 tsp water average
1.83g
4.03g
trial one
trial two
trial three
1.4g
2.1g
2.0g
4.1g
4.1g
3.9g
tsp water average
4.6g
5.33g
trial one
trial two
trial three
4.3g
4.4g
5.1g
4.7g
6.0g
5.3g
1/2 tsp milk average
2.87g
2.13g
trial one
trial two
trial three
3.1g
2.8g
2.7g
1.9g
2.3g
2.2g
tsp milk average
4.03g
3.83g
trial one
trial two
trial three
4.1g
3.9g
4.1g
3.9g
4.0g
3.6g

Sunday, December 2, 2012

Winter Project

Toilet Paper Project


Which toilet paper brand is the most effective and how which ply count is the most effective. We will take the toilet paper brand A ply count X and put a liquid onto it and test how absorbent the toilet paper is. We will repeat this for another liquid and twice the original volume. This will be repeated for all other ply counts/ Brands. We will test absorbency by looking at how much of the liquid remains on the table after we pour it.

Randomization-We will randomly select which roll will be tested on. For example if we have to rolls of Brand A Ply count X we will assign each roll a number of 1 and 2 then randomly select which roll we will apply the first liquid to and which roll we will apply the second liquid to using a random number generator.
Blocking The ply count for each brand will be our blocking variable

Repetition- We will repeat the experiment a minimum of 2 to 3 times to ensure that the experiment is accurate
Control- Our controls are to use the same volumes for each brand that we test and to use the same liquid for each brand that we test.

Our factor is the type and amount of liquid

Our levels are the different types of liquids (liquid 1 and liquid 2) and the different volumes (volume 1 and volume 2)

Our treatments are liquid 1 volume 1, liquid 1 volume 2, liquid 2 volume 1, and liquid 2 volume 2. This will be applied to each roll

We will complete this experiment on a single day most likely the 8th of december 

Saturday, October 13, 2012

Stats at the movies

This article is about the correlation between the rotten tomatoes rating of a movie and its Domestic box office gross. In the first part of the article he relates only two variables, the rotten tomatoes rating is his explanatory variable and the response variable was the box office gross. In the second part of the article he made a regression for box office gross using multiple explanatory variables. I thought it was very interesting how close the projection was for mission impossible three compared to the actual, despite the  fact that his r value was relatively low. This article directly relates to what we are learning in stats right now. In the article he talks about regression lines which we are learning about right now. Also in the appendix he goes over the residual plots etc. which we are also learning about. We did not talk about how you can use multiple explanatory variables. We also have not talked about binary variables. Captain America had a rotten tomatoes score of 79% according to the articles regression equation it should have grossed $88.3 million it actually grossed $176.6 million. His model did not predict how the gross very well for Captain America. Holy Motors a film due to be released this week has a rt rating of 92% and it should gross $97.13.

Wednesday, October 10, 2012


REASSESSMENT A.2
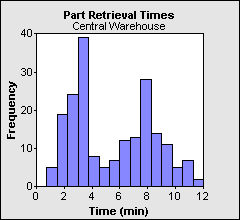
This histogram represents the amount of time it takes to retrive parts various parts from the central warehouse. There is a gap between 0-1 minute which indicates that parts cannot be retrieved in less time. The histogram is bimodal with the first mode located at 3 minutes, the frequency at this time is about 39. The second mode is at 8 minutes with a frequency of 30. This indicates that most of time, it takes either 3 or 8 minutes to retrieve a part from the central warehouse. There are no outliers in the distribution. The median of the distribution would be at about 4 or 5 minutes. The range of the entire distribution is 11 which means that from there is an 11 minute difference in time it takes to retrieve a part from the shortest time to the longest time.


Monday, September 24, 2012

INFOGRAPHIC

I chose distracted driving as my topic mostly because the day I chose my topic someone swerved into my lane and was close to hitting me. I could clearly tell that they were not paying attention, what was worse is that it was an adult. I wanted to show in my info graphic how prevalent distracted driving is and how many crashes it can cause. I also wanted to show how many states are banning cell phone use especially after our state recently enacted new legislation on the topic. 

Friday, September 7, 2012


Fat Man
By Vidita Kannikeswaran and Amrish Karnik

One sunny day, when Mario Franchini was running his pizza shop just like any other day, he noticed that the amount of customers he'd had over the past week had greatly diminished. He was puzzled as to why he had no customers because his pizza was the most delicious, greasy pizza in the whole town.

Just as he was placing pieces of pepperoni on one of his signature delicious pizzas, he heard some commotion outside of the door. He stepped outside to see that there was a new restaurant right across from his, called "Organic Pizza" and it seemed to be extremely popular with the people. This made him mad.

He marched right over to Organic Pizza to yell at them for stealing his business. He slammed the door open and starting knocking over all the tables and chairs and throwing gross healthy vegetable pizzas on the floor. Just as he was about to throw a chair into the back wall, he was stopped by some unknown force.

"STOP RIGHT THERE" said a voice from behind him.

Mario Franchini turned around to see a flying green man covered in leaves and vegetables.

"I AM ORGANIC MAN! AND I WILL STOP YOU FROM DESTROYING THE HEALTH OF THESE PEOPLE!"

Mario Franchini was fuming with anger, causing him to turn into his alter ego: FAT MAN.

He grew to three times his size and began to pelt food everywhere and turn everyone into pizzas with his mind powers. He crushed all the tables and chairs with his fatness and completely destroyed the Organic Pizza Restaurant. Organic Man ran away screaming like a little girl.

The next day, Mario Franchini's Pizza was just as crowded as usual and Organic Man never bothered him again.

Thursday, August 30, 2012

5 W's

The five W's are very important in figuring out the context of data in statistics. Without context it would be much harder to analyze and make conclusions about the data. They identify who what when where why and how. The what is especially important because it tells us what the data is and what the units are. Why tells us the objective after we complete all the steps. 

Tuesday, August 28, 2012

Stats

Right now I am really enjoying statistics. I like how we are learning practical applications of statistics rather than just the probability of something when you flip a coin 100 times. I also am surprised at how much analysis of data we do in the class. I was expecting a lot more "math". I thought the Westvaco project was pretty cool and different from what i thought statistics was. 

Sunday, August 26, 2012

Survival


In this activity we ranked the usefulness of certain items in a survival setting individually and, later, as a small group. After that we looked how the rankings compared between the different groups and found average ranking as well as the median and range. Finally we compared our rankings to that of an expert and found the average absolute difference.

We would have survived with a medium amount of difficulty. OUr rankings were similar in some cases with the survival expert but were way off in other examples. Our average absolute difference for the entire list was 4.84. This means we were about 5 points off each item's importance. This could lead to difficulty in a survival situation

I would have survived with limited difficulty. Most of my rankings were very similar to the experts with  a few exceptions which were completely different. My average absolute difference was about 2.18 so I was about 2 rankings different for each item. This means I saw the list of items in a similar way to the expert so I would be able to survive well.